
- Start >
- Meteorology >
- Air moisture >
- Isar >
- Obersöchering >
- Chart of total period

Chart of total period Obersöchering
Air moisture from 06.07.2016 to 21.08.2023
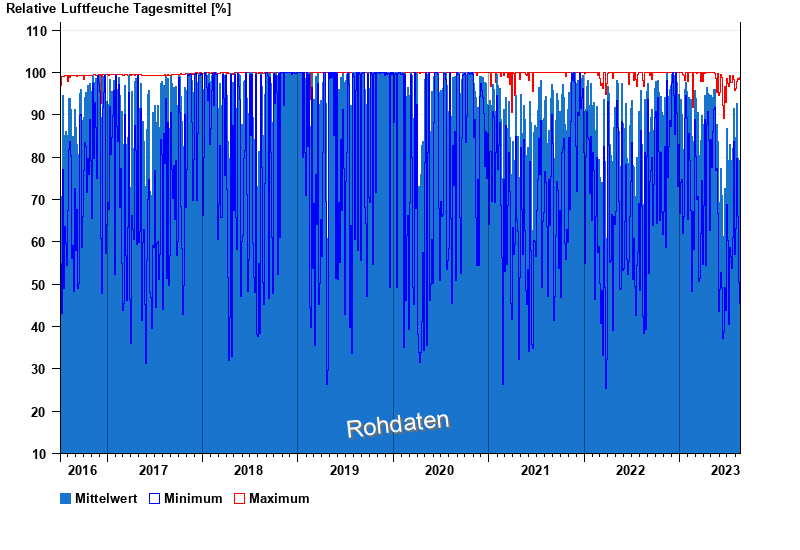
Note: The time series in the selected period has gaps.
note
Derzeit nicht verfügbar
| Date | Mean value [%] | Maximum [%] | Minimum [%] |
|---|---|---|---|
| 21.08.2023 | 90.0 | 91.7 | 86.2 |
| 20.08.2023 | 62.5 | 91.3 | 36.1 |
| 19.08.2023 | 65.2 | 93.6 | 34.3 |
| 18.08.2023 | 74.1 | 98.9 | 38.4 |
| 17.08.2023 | 79.2 | 98.4 | 45.4 |
| 16.08.2023 | 73.5 | 98.4 | 47.0 |
| 15.08.2023 | 74.8 | 90.7 | 44.9 |
© Bayerisches Landesamt für Umwelt 2026