
- Start >
- Meteorology >
- Air moisture >
- Unterer Main >
- Helmstadt >
- Chart of total period

Chart of total period Helmstadt
Air moisture from 04.08.1994 to 03.05.2024
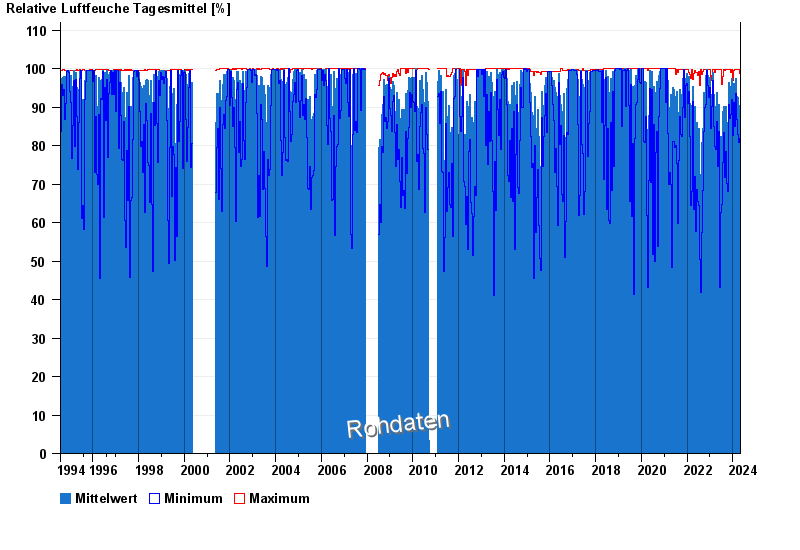
Note: The time series in the selected period has gaps.
| Date | Mean value [%] | Maximum [%] | Minimum [%] |
|---|---|---|---|
| 03.05.2024 | 87.7 | 94.8 | 74.4 |
| 02.05.2024 | 74.5 | 95.7 | 46.6 |
| 01.05.2024 | 64.9 | 93.4 | 40.2 |
| 30.04.2024 | 66.8 | 94.3 | 31.2 |
| 29.04.2024 | 69.0 | 90.8 | 42.3 |
| 28.04.2024 | 64.8 | 87.9 | 47.6 |
| 27.04.2024 | 66.6 | 99.3 | 33.0 |
© Bayerisches Landesamt für Umwelt 2024