
- Start >
- Meteorology >
- Air moisture >
- Inn >
- Rotthalmünster >
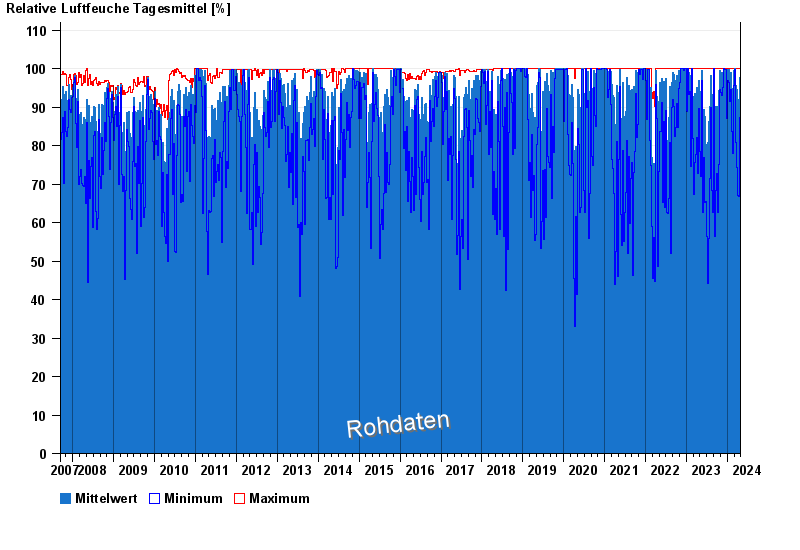
- Chart of total period

Chart of total period Rotthalmünster
Air moisture from 14.09.2007 to 26.04.2024
Note: The time series in the selected period has gaps.
| Date | Mean value [%] | Maximum [%] | Minimum [%] |
|---|---|---|---|
| 26.04.2024 | 79.7 | 100.0 | 38.8 |
| 25.04.2024 | 88.3 | 100.0 | 62.6 |
| 24.04.2024 | 92.4 | 100.0 | 62.9 |
| 23.04.2024 | 85.8 | 100.0 | 63.7 |
| 22.04.2024 | 66.8 | 90.3 | 49.2 |
| 21.04.2024 | 97.0 | 100.0 | 81.1 |
| 20.04.2024 | 96.4 | 100.0 | 87.2 |
© Bayerisches Landesamt für Umwelt 2024