
- Start >
- Meteorology >
- Global radiation >
- Inn >
- Rotthalmünster >
- Chart of total period

Chart of total period Rotthalmünster
Global radiation from 18.09.2007 to 23.04.2024
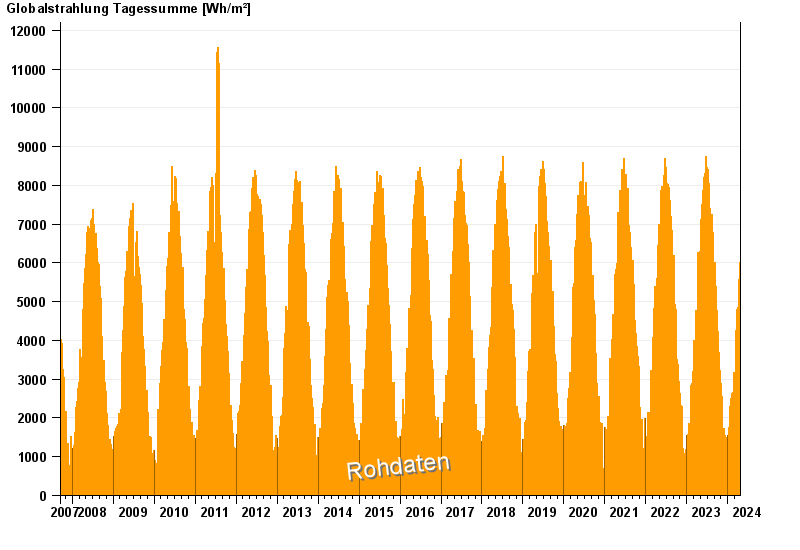
Note: The time series in the selected period has gaps.
| Date | Global radiation [Wh/m²] |
|---|---|
| 23.04.2024 | 1330.2 |
| 22.04.2024 | 4817.5 |
| 21.04.2024 | 3339.2 |
| 20.04.2024 | 3640.1 |
| 19.04.2024 | 2883.3 |
| 18.04.2024 | 2878.6 |
| 17.04.2024 | 3103.6 |
© Bayerisches Landesamt für Umwelt 2024