
- Start >
- Meteorology >
- Air moisture >
- Oberer Main - Elbe >
- Kitzenried >
- Chart of total period

Chart of total period Kitzenried
Air moisture from 01.07.1993 to 13.01.2026
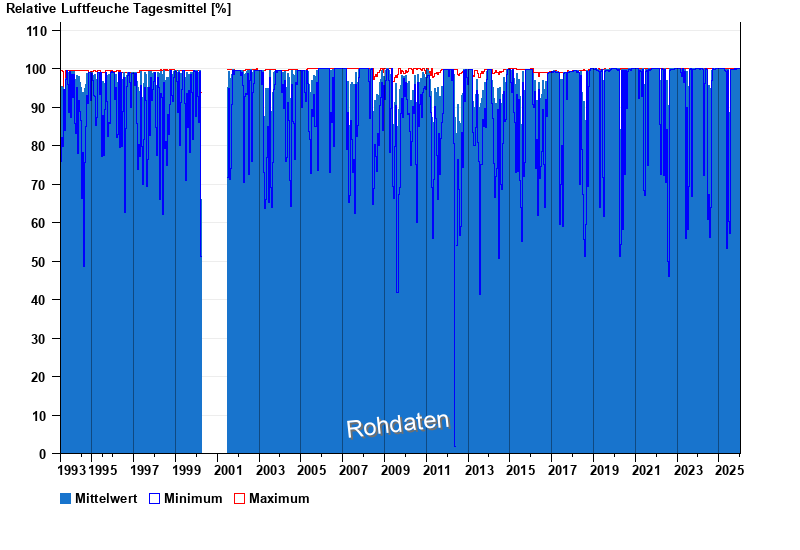
Note: The time series in the selected period has gaps.
note
Derzeit nicht verfügbar
| Date | Mean value [%] | Maximum [%] | Minimum [%] |
|---|---|---|---|
| 13.01.2026 | 100.0 | 100.0 | 100.0 |
| 12.01.2026 | 100.0 | 100.0 | 100.0 |
| 11.01.2026 | 100.0 | 100.0 | 99.5 |
| 10.01.2026 | 100.0 | 100.0 | 99.9 |
| 09.01.2026 | 100.0 | 100.0 | 100.0 |
| 08.01.2026 | 100.0 | 100.0 | 99.7 |
| 07.01.2026 | 93.6 | 100.0 | 71.4 |
© Bayerisches Landesamt für Umwelt 2026