
- Start >
- Groundwater >
- Waterlevel of upper layer >
- Bayern >
- Hitzhofen GWM 7 >
- Chart of total period

Chart of total period Hitzhofen GWM 7
Groundwater levels of the total period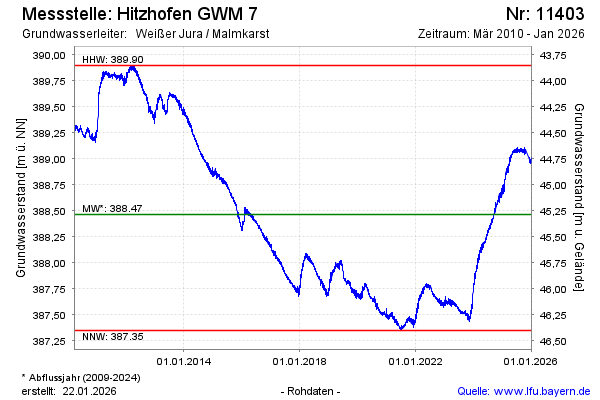
Groundwater level [m above sealevel]: 389.05
Distance to surface [m]: 44.70
Last value from 25.03.2026 13:00
Ground level [m above sealevel]: 433.75
| Date | Groundwater level [m above sealevel] |
|---|---|
| 25.03.2026 | 389.04 |
| 24.03.2026 | 388.98 |
| 23.03.2026 | 388.97 |
| 22.03.2026 | 388.99 |
| 21.03.2026 | 388.99 |
| 20.03.2026 | 388.99 |
| 19.03.2026 | 388.98 |
| 18.03.2026 | 388.97 |
© Bayerisches Landesamt für Umwelt 2026