
- Start >
- Groundwater >
- Flow of springs >
- Isar >
- Hitzler/Marienberg 1 >
- Chart of total period

Chart of total period Hitzler/Marienberg 1
Flow of wells of the total period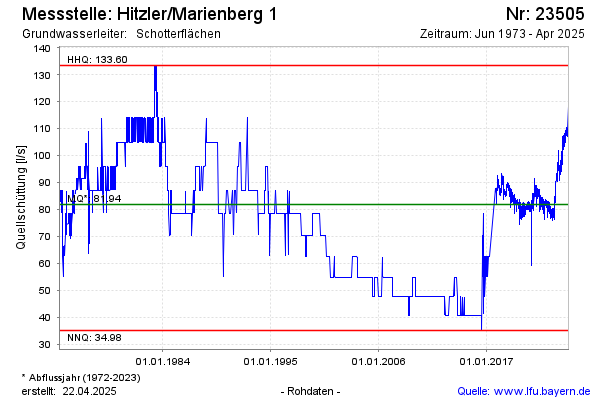
Flow [l/s]: 80,11
Last value from 06.05.2024 09:00
Ground level [m above sealevel]: 391.31
| Date | Flow of well [l/s] |
|---|---|
| 06.05.2024 | 86.16 |
| 05.05.2024 | 87.19 |
| 04.05.2024 | 87.59 |
| 03.05.2024 | 87.33 |
| 02.05.2024 | 89.37 |
| 01.05.2024 | 91.31 |
| 30.04.2024 | 90.71 |
| 29.04.2024 | 91.86 |
© Bayerisches Landesamt für Umwelt 2024