
- Start >
- Groundwater >
- Temperature of springs >
- Isar >
- Hitzler/Marienberg 1 >
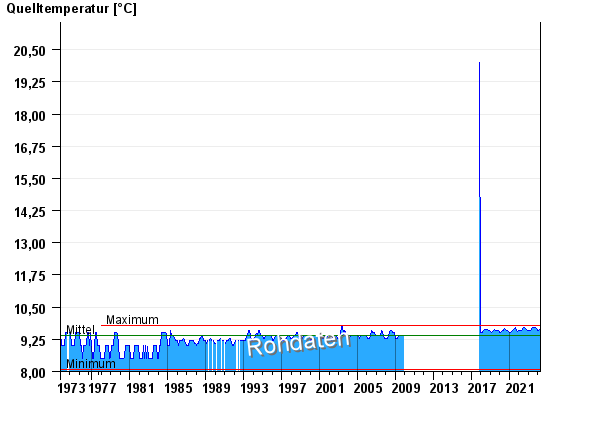
- Chart of total period

Chart of total period Hitzler/Marienberg 1
Temperature of springs from 10.09.1973 to 16.04.2024
| Date | Temperature of springs [°C] |
|---|---|
| 16.04.2024 | 9.6 |
| 15.04.2024 | 9.6 |
| 14.04.2024 | 9.7 |
| 13.04.2024 | 9.7 |
| 12.04.2024 | 9.6 |
| 11.04.2024 | 9.6 |
| 10.04.2024 | 9.6 |
© Bayerisches Landesamt für Umwelt 2024