
- Start >
- Groundwater >
- Flow of springs >
- Bayern >
- Hohenmühle 8/2 >
- Chart of total period

Chart of total period Hohenmühle 8/2
Flow of wells of the total period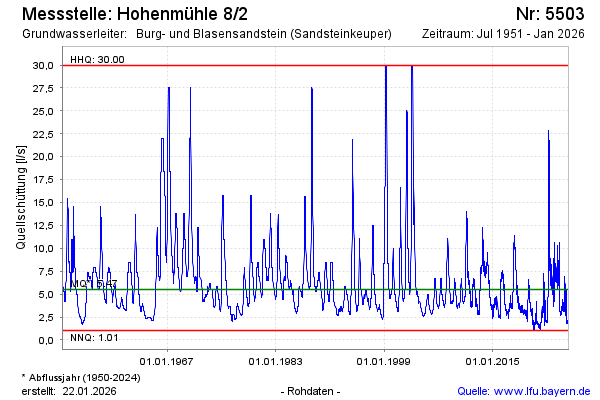
Flow [l/s]: 5,76
Last value from 27.07.2024 06:00
Ground level [m above sealevel]: 248.00
| Date | Flow of well [l/s] |
|---|---|
| 26.07.2024 | 5.51 |
| 25.07.2024 | 5.51 |
| 24.07.2024 | 5.59 |
| 23.07.2024 | 5.62 |
| 22.07.2024 | 5.64 |
| 21.07.2024 | 5.66 |
| 20.07.2024 | 5.74 |
| 19.07.2024 | 5.62 |
© Bayerisches Landesamt für Umwelt 2024