
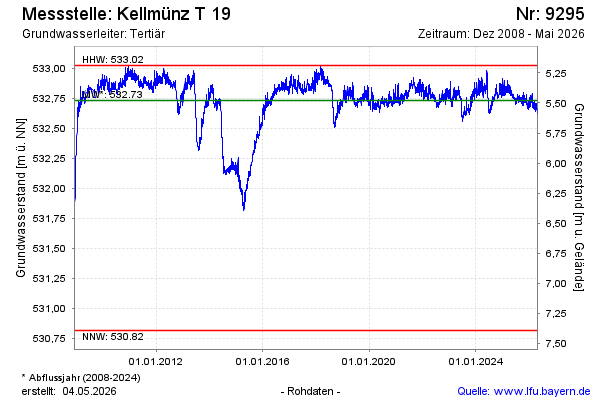
Chart of total period Kellmünz T 19
Groundwater level [m above sealevel]: 532,60
Distance to surface [m]: 5,61
Last value from 23.07.2026 08:00
Ground level [m above sealevel]: 538.21
| Date | Groundwater level [m above sealevel] |
|---|---|
| 23.07.2026 | 532.61 |
| 22.07.2026 | 532.60 |
| 21.07.2026 | 532.60 |
| 20.07.2026 | 532.61 |
| 19.07.2026 | 532.62 |
| 18.07.2026 | 532.63 |
| 17.07.2026 | 532.63 |
| 16.07.2026 | 532.62 |