
- Start >
- Groundwater >
- Waterlevel of deep layer >
- Bayern >
- Büchold MU 13 >
- Chart of total period

Chart of total period Büchold MU 13
Groundwater levels of the total period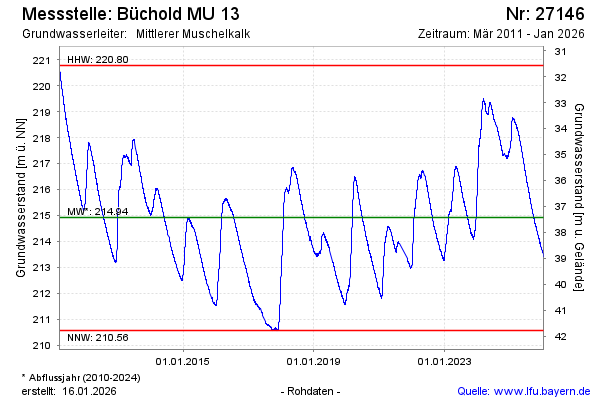
Groundwater level [m above sealevel]: 215.84
Distance to surface [m]: 36.51
Last value from 12.04.2026 10:00
Ground level [m above sealevel]: 252.35
| Date | Groundwater level [m above sealevel] |
|---|---|
| 12.04.2026 | 215.86 |
| 11.04.2026 | 215.87 |
| 10.04.2026 | 215.88 |
| 09.04.2026 | 215.89 |
| 08.04.2026 | 215.89 |
| 07.04.2026 | 215.90 |
| 06.04.2026 | 215.91 |
| 05.04.2026 | 215.96 |
© Bayerisches Landesamt für Umwelt 2026