
- Startseite >
- Flüsse >
- Wasserstand >
- Unterer Main >
- Faulbach >
- Jahresgrafik

Jahresgrafik Faulbach / Main
Wasserstand vom 29.03.2024 bis zum 28.03.2025
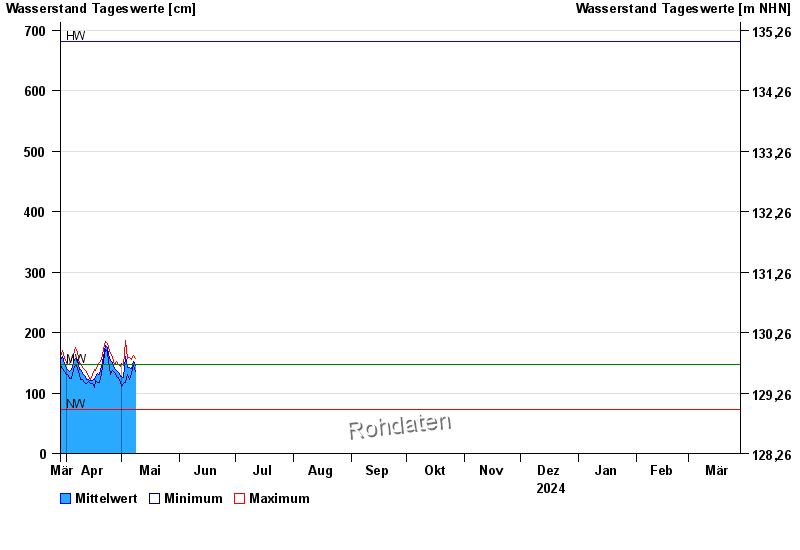
| Datum | Mittelwert [cm] | Maximum [cm] | Minimum [cm] |
|---|---|---|---|
| 28.04.2024 | 136 | 143 | 132 |
| 27.04.2024 | 141 | 147 | 134 |
| 26.04.2024 | 150 | 159 | 138 |
| 25.04.2024 | 154 | 165 | 130 |
| 24.04.2024 | 163 | 176 | 150 |
| 23.04.2024 | 175 | 182 | 168 |
| 22.04.2024 | 178 | 186 | 172 |
© Bayerisches Landesamt für Umwelt 2024