
- Startseite >
- Flüsse >
- Wasserstand >
- Unterer Main >
- Faulbach >
- Jahresgrafik

Jahresgrafik Faulbach / Main
Wasserstand vom 29.03.2023 bis zum 28.03.2024
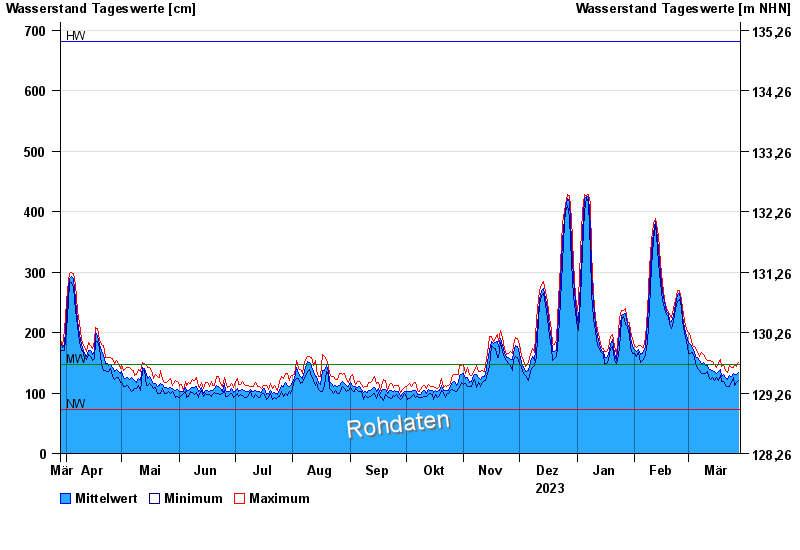
| Datum | Mittelwert [cm] | Maximum [cm] | Minimum [cm] |
|---|---|---|---|
| 28.03.2024 | 134 | 150 | 121 |
| 27.03.2024 | 130 | 144 | 117 |
| 26.03.2024 | 130 | 147 | 112 |
| 25.03.2024 | 132 | 143 | 125 |
| 24.03.2024 | 128 | 142 | 117 |
| 23.03.2024 | 129 | 146 | 111 |
| 22.03.2024 | 123 | 134 | 111 |
© Bayerisches Landesamt für Umwelt 2024