
- Startseite >
- Flüsse >
- Wasserstand >
- Unterer Main >
- Faulbach >
- Jahresgrafik

Jahresgrafik Faulbach / Main
Wasserstand vom 29.03.2024 bis zum 28.03.2025
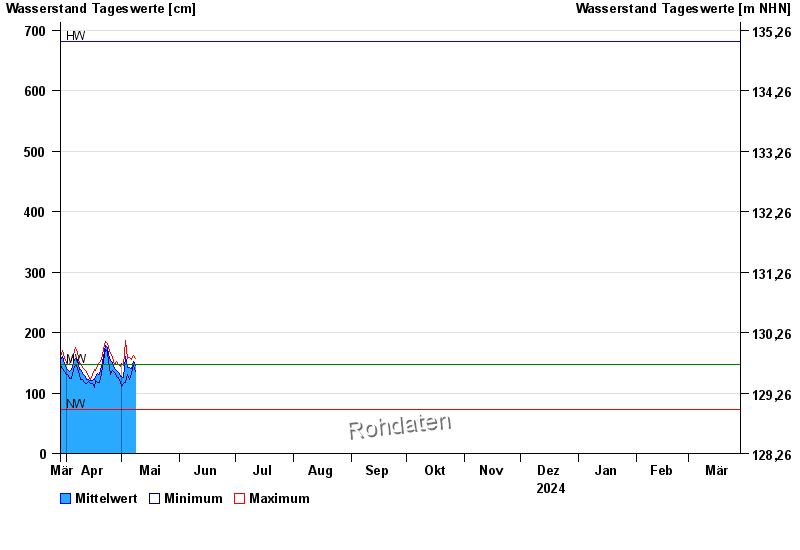
| Datum | Mittelwert [cm] | Maximum [cm] | Minimum [cm] |
|---|---|---|---|
| 13.05.2024 | 117 | 126 | 110 |
| 12.05.2024 | 126 | 144 | 109 |
| 11.05.2024 | 129 | 142 | 119 |
| 10.05.2024 | 129 | 146 | 116 |
| 09.05.2024 | 138 | 149 | 119 |
| 08.05.2024 | 145 | 157 | 132 |
| 07.05.2024 | 152 | 162 | 145 |
© Bayerisches Landesamt für Umwelt 2024