
- Startseite >
- Flüsse >
- Wasserstand >
- Unterer Main >
- Faulbach >
- Jahresgrafik

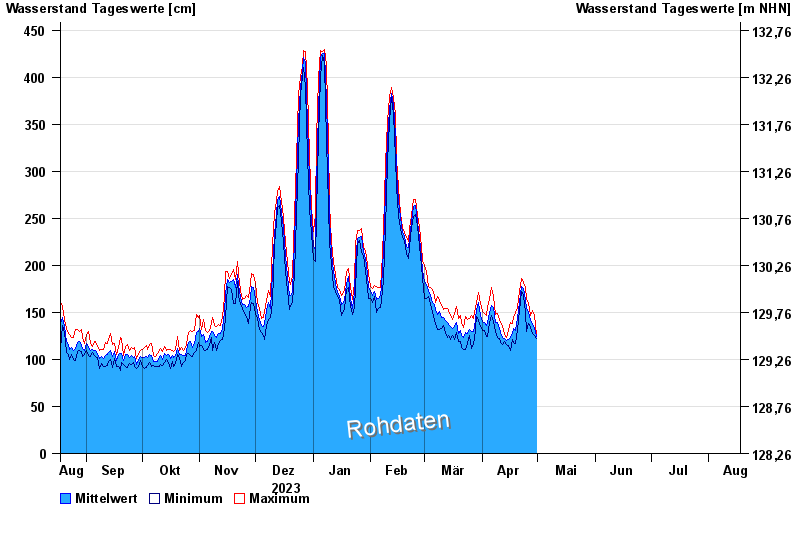
Jahresgrafik Faulbach / Main
Wasserstand vom 18.08.2023 bis zum 17.08.2024
| Datum | Mittelwert [cm] | Maximum [cm] | Minimum [cm] |
|---|---|---|---|
| 17.05.2024 | 117 | 130 | 108 |
| 16.05.2024 | 118 | 130 | 108 |
| 15.05.2024 | 118 | 138 | 110 |
| 14.05.2024 | 121 | 132 | 112 |
| 13.05.2024 | 123 | 143 | 110 |
| 12.05.2024 | 126 | 144 | 109 |
| 11.05.2024 | 129 | 142 | 119 |
© Bayerisches Landesamt für Umwelt 2024