
- Startseite >
- Flüsse >
- Wasserstand >
- Unterer Main >
- Faulbach >
- Jahresgrafik

Jahresgrafik Faulbach / Main
Wasserstand vom 18.08.2023 bis zum 17.08.2024
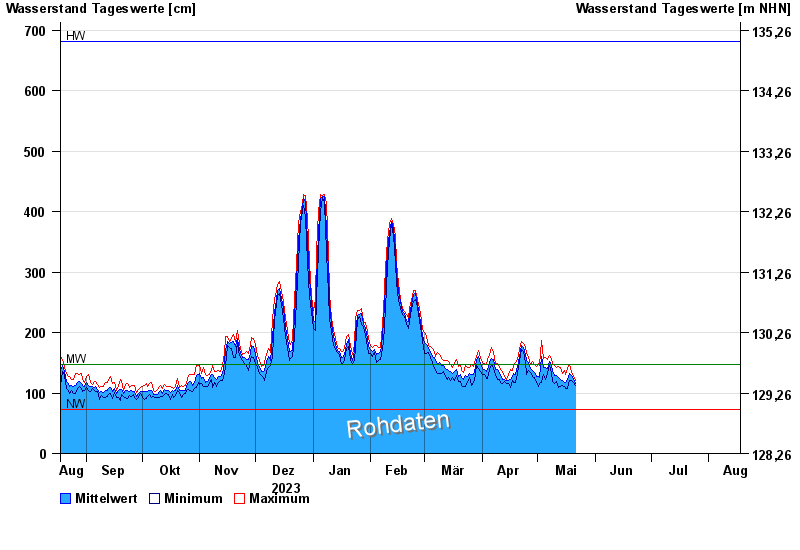
| Datum | Mittelwert [cm] | Maximum [cm] | Minimum [cm] |
|---|---|---|---|
| 30.04.2024 | 122 | 127 | 117 |
| 29.04.2024 | 134 | 147 | 125 |
| 28.04.2024 | 137 | 152 | 128 |
| 27.04.2024 | 141 | 147 | 134 |
| 26.04.2024 | 150 | 159 | 138 |
| 25.04.2024 | 154 | 165 | 130 |
| 24.04.2024 | 163 | 176 | 150 |
© Bayerisches Landesamt für Umwelt 2024