
- Startseite >
- Flüsse >
- Wasserstand >
- Unterer Main >
- Faulbach >
- Jahresgrafik

Jahresgrafik Faulbach / Main
Wasserstand vom 18.08.2023 bis zum 17.08.2024
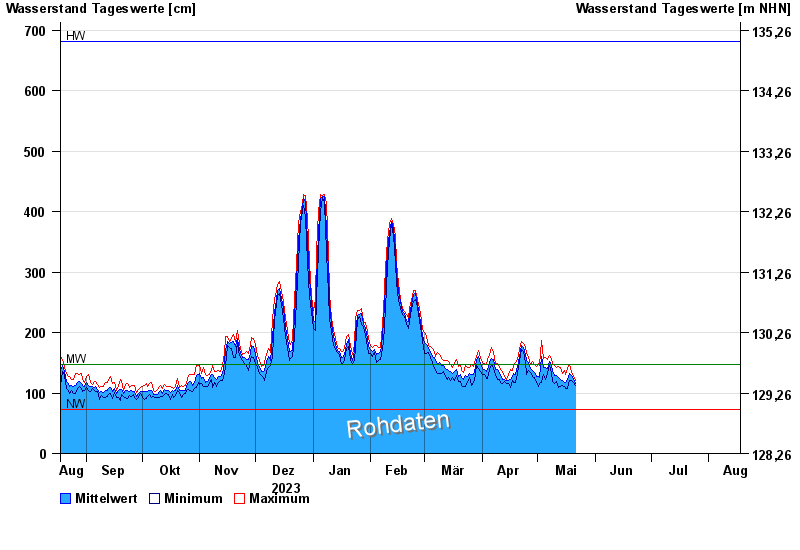
| Datum | Mittelwert [cm] | Maximum [cm] | Minimum [cm] |
|---|---|---|---|
| 21.05.2024 | 115 | 121 | 113 |
| 20.05.2024 | 122 | 128 | 117 |
| 19.05.2024 | 129 | 136 | 121 |
| 18.05.2024 | 133 | 147 | 120 |
| 17.05.2024 | 122 | 141 | 108 |
| 16.05.2024 | 118 | 130 | 108 |
| 15.05.2024 | 118 | 138 | 110 |
© Bayerisches Landesamt für Umwelt 2024