
- Start >
- Rivers >
- Watertemperature >
- Naab - Regen >
- Amberg >
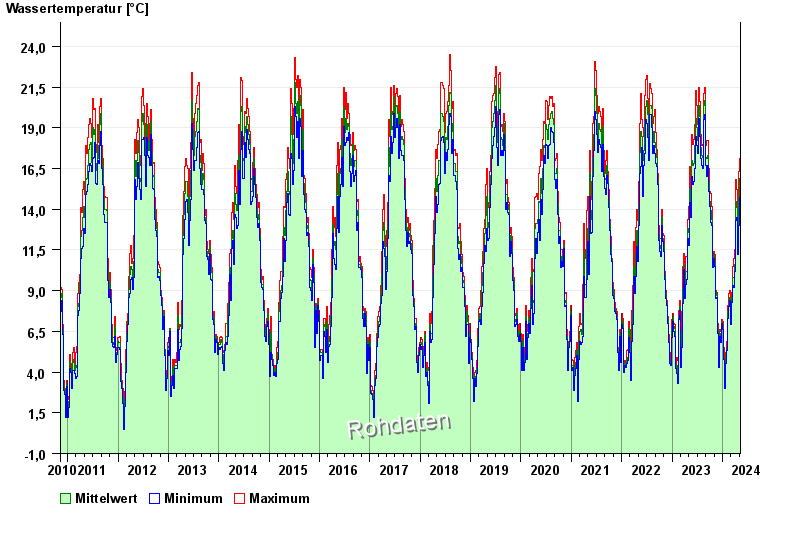
- Chart of total period

Chart of total period Amberg / Vils
Water temperature from 10.11.2010 to 10.05.2024
| Date | Water temperature [°C] | Maximum [°C] | Minimum [°C] |
|---|---|---|---|
| 10.05.2024 | 13.3 | 14.9 | 12.4 |
| 09.05.2024 | 13.0 | 14.3 | 11.7 |
| 08.05.2024 | 12.8 | 13.1 | 12.6 |
| 07.05.2024 | 13.6 | 14.2 | 13.2 |
| 06.05.2024 | 13.8 | 14.7 | 12.9 |
| 05.05.2024 | 13.6 | 14.3 | 12.9 |
| 04.05.2024 | 14.1 | 14.9 | 13.3 |
© Bayerisches Landesamt für Umwelt 2024