
- Start >
- Rivers >
- Watertemperature >
- Inn >
- Feldolling >
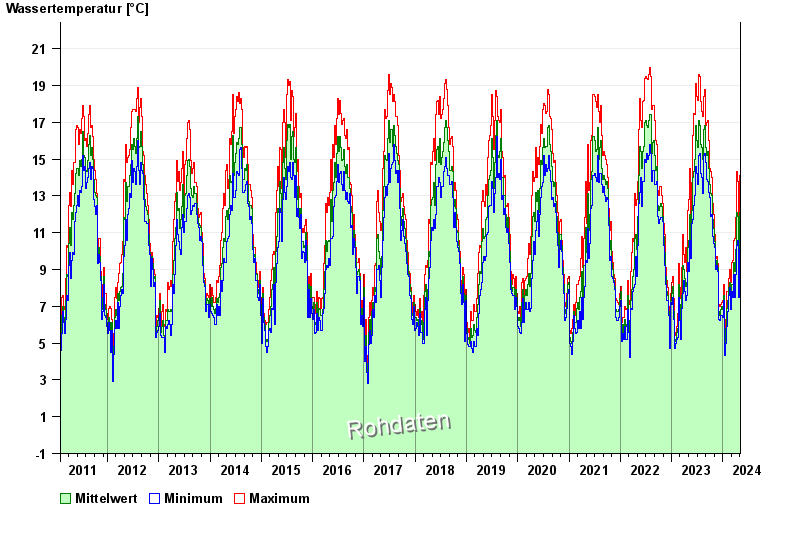
- Chart of total period

Chart of total period Feldolling / Mangfall
Water temperature from 01.02.2011 to 04.05.2024
| Date | Water temperature [°C] | Maximum [°C] | Minimum [°C] |
|---|---|---|---|
| 04.05.2024 | 10.1 | 10.1 | 10.0 |
| 03.05.2024 | 11.0 | 12.1 | 10.1 |
| 02.05.2024 | 12.5 | 14.4 | 10.9 |
| 01.05.2024 | 12.0 | 13.9 | 10.1 |
| 30.04.2024 | 12.1 | 14.1 | 10.1 |
| 29.04.2024 | 11.6 | 13.7 | 9.5 |
| 28.04.2024 | 10.8 | 12.5 | 8.9 |
© Bayerisches Landesamt für Umwelt 2024