
- Start >
- Rivers >
- Waterlevel >
- Regnitz >
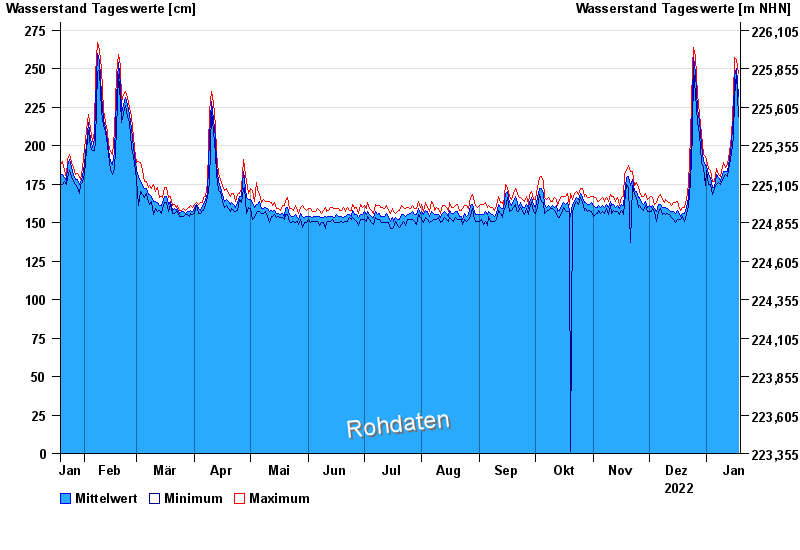
- Trunstadt >
- Chart of year

Chart of year Trunstadt / Main
Waterlevel from 19.01.2022 to 18.01.2023
| Date | Mean value [cm] | Maximum [cm] | Minimum [cm] |
|---|---|---|---|
| 18.01.2023 | 232 | 247 | 219 |
| 17.01.2023 | 250 | 256 | 247 |
| 16.01.2023 | 245 | 257 | 232 |
| 15.01.2023 | 221 | 232 | 205 |
| 14.01.2023 | 202 | 206 | 195 |
| 13.01.2023 | 191 | 196 | 188 |
| 12.01.2023 | 183 | 188 | 180 |
© Bayerisches Landesamt für Umwelt 2024