
- Start >
- Rivers >
- Waterlevel >
- Regnitz >
- Schönbrunn >
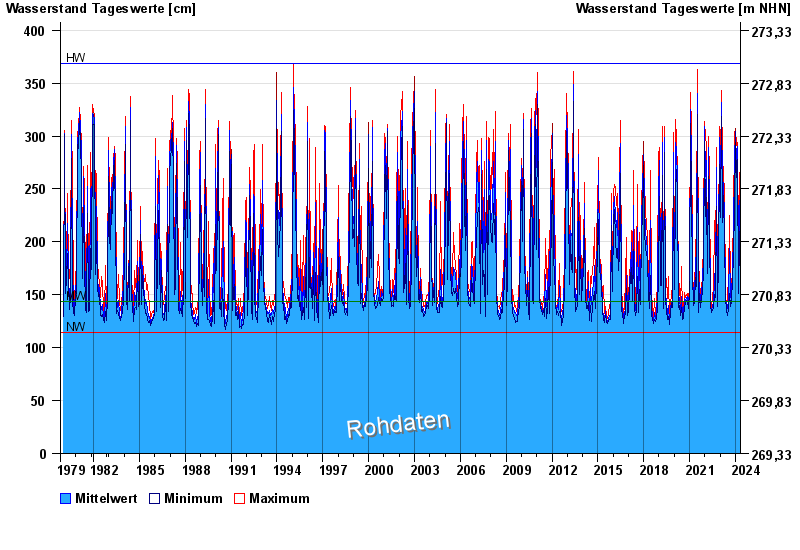
- Chart of total period

Chart of total period Schönbrunn / Rauhe Ebrach
Waterlevel from 01.11.1979 to 02.05.2024
note
Beeinflussung des Abflusses aufgrund Hindernisse im Unterlauf
| Date | Mean value [cm] | Maximum [cm] | Minimum [cm] |
|---|---|---|---|
| 02.05.2024 | 144 | 144 | 144 |
| 01.05.2024 | 145 | 146 | 144 |
| 30.04.2024 | 147 | 149 | 146 |
| 29.04.2024 | 150 | 153 | 149 |
| 28.04.2024 | 155 | 157 | 153 |
| 27.04.2024 | 162 | 166 | 157 |
| 26.04.2024 | 169 | 174 | 166 |
© Bayerisches Landesamt für Umwelt 2024