
- Start >
- Rivers >
- Waterlevel >
- Regnitz >
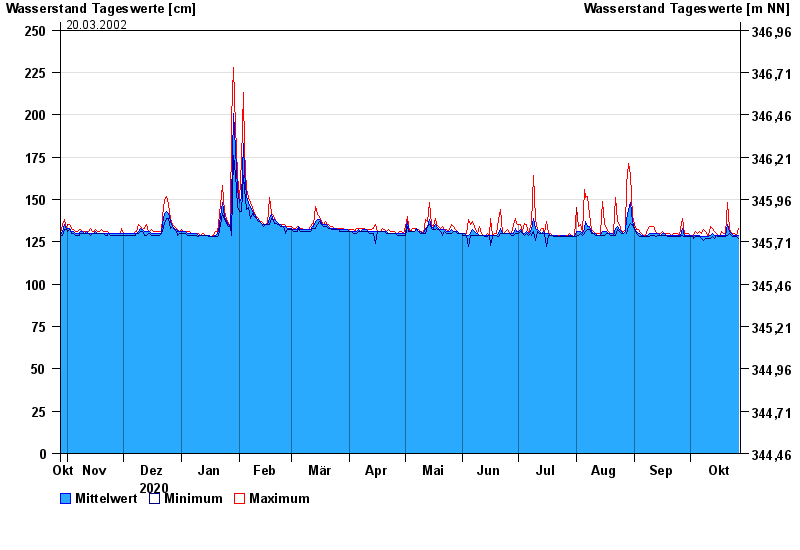
- Schnaittach Markt >
- Chart of year

Chart of year Schnaittach Markt / Schnaittach
Waterlevel from 28.10.2020 to 27.10.2021
- 26.01.1995 Wasserstand: 280 cm
- 23.12.2012 Wasserstand: 267 cm
- 27.10.1998 Wasserstand: 256 cm
- 13.01.2011 Wasserstand: 252 cm
- 20.03.2002 Wasserstand: 250 cm
| Date | Mean value [cm] | Maximum [cm] | Minimum [cm] |
|---|---|---|---|
| 27.10.2021 | 129 | 133 | 127 |
| 26.10.2021 | 129 | 129 | 128 |
| 25.10.2021 | 129 | 130 | 128 |
| 24.10.2021 | 129 | 130 | 128 |
| 23.10.2021 | 130 | 130 | 129 |
| 22.10.2021 | 131 | 133 | 130 |
| 21.10.2021 | 135 | 148 | 129 |
© Bayerisches Landesamt für Umwelt 2024