
- Start >
- Rivers >
- Waterlevel >
- Regnitz >
- Roth Kläranlage >
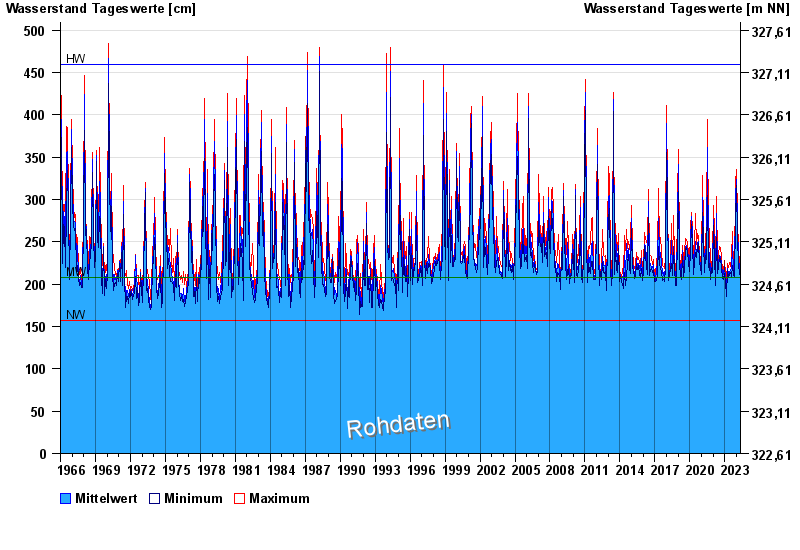
- Chart of total period

Chart of total period Roth Kläranlage / Rednitz
Waterlevel from 01.01.1966 to 05.05.2024
| Date | Mean value [cm] | Maximum [cm] | Minimum [cm] |
|---|---|---|---|
| 05.05.2024 | 213 | 213 | 212 |
| 04.05.2024 | 212 | 213 | 210 |
| 03.05.2024 | 209 | 211 | 207 |
| 02.05.2024 | 209 | 209 | 208 |
| 01.05.2024 | 202 | 209 | 192 |
| 30.04.2024 | 197 | 198 | 196 |
| 29.04.2024 | 189 | 198 | 180 |
© Bayerisches Landesamt für Umwelt 2024