
- Start >
- Rivers >
- Waterlevel >
- Regnitz >
- Reichenbach >
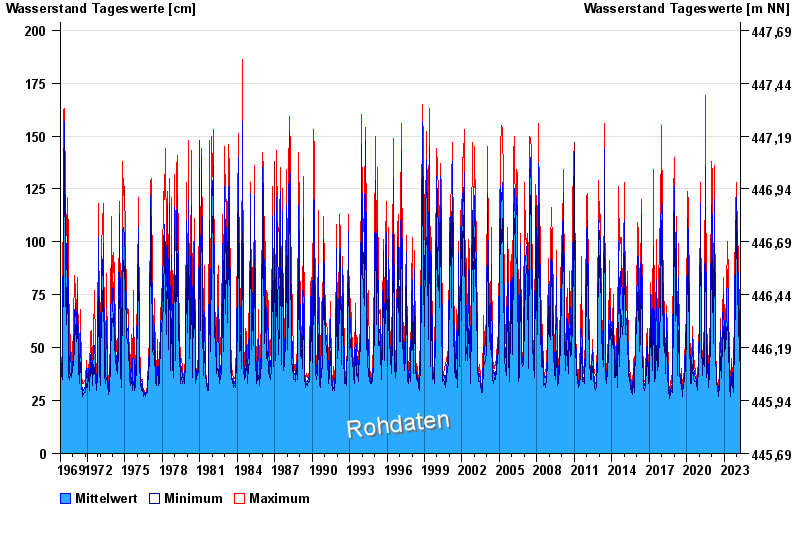
- Chart of total period

Chart of total period Reichenbach / Wörnitz
Waterlevel from 01.11.1969 to 26.04.2024
| Date | Mean value [cm] | Maximum [cm] | Minimum [cm] |
|---|---|---|---|
| 26.04.2024 | 36 | 37 | 36 |
| 25.04.2024 | 36 | 38 | 36 |
| 24.04.2024 | 37 | 37 | 37 |
| 23.04.2024 | 38 | 40 | 37 |
| 22.04.2024 | 41 | 43 | 40 |
| 21.04.2024 | 41 | 44 | 39 |
| 20.04.2024 | 43 | 46 | 40 |
© Bayerisches Landesamt für Umwelt 2024