
- Start >
- Rivers >
- Waterlevel >
- Regnitz >
- Pettstadt >
- Chart of total period

Chart of total period Pettstadt / Regnitz
Waterlevel from 27.10.2004 to 26.04.2024
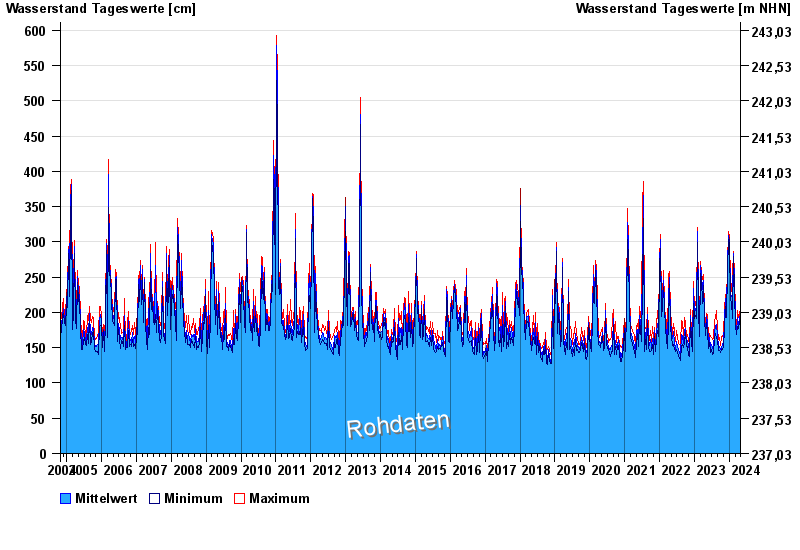
| Date | Mean value [cm] | Maximum [cm] | Minimum [cm] |
|---|---|---|---|
| 26.04.2024 | 171 | 175 | 166 |
| 25.04.2024 | 173 | 175 | 172 |
| 24.04.2024 | 179 | 187 | 173 |
| 23.04.2024 | 188 | 196 | 181 |
| 22.04.2024 | 200 | 208 | 192 |
| 21.04.2024 | 189 | 194 | 186 |
| 20.04.2024 | 181 | 188 | 172 |
© Bayerisches Landesamt für Umwelt 2024