
- Start >
- Rivers >
- Waterlevel >
- Regnitz >
- Lentersdorf >
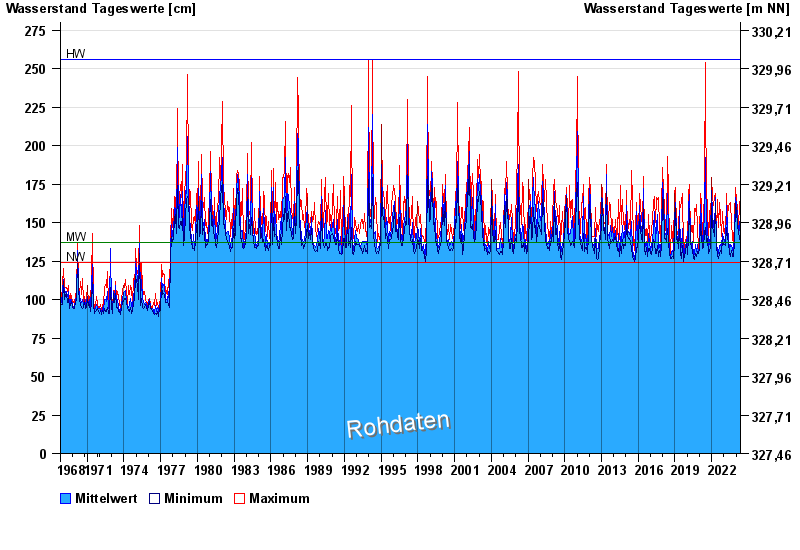
- Chart of total period

Chart of total period Lentersdorf / Bibert
Waterlevel from 28.10.1968 to 07.05.2024
| Date | Mean value [cm] | Maximum [cm] | Minimum [cm] |
|---|---|---|---|
| 07.05.2024 | 134 | 136 | 133 |
| 06.05.2024 | 137 | 140 | 135 |
| 05.05.2024 | 135 | 140 | 132 |
| 04.05.2024 | 133 | 134 | 132 |
| 03.05.2024 | 138 | 146 | 133 |
| 02.05.2024 | 134 | 148 | 131 |
| 01.05.2024 | 132 | 133 | 131 |
© Bayerisches Landesamt für Umwelt 2024