
- Start >
- Rivers >
- Waterlevel >
- Regnitz >
- Laufermühle >
- Chart of year

Chart of year Laufermühle / Aisch
Waterlevel from 01.01.2024 to 08.05.2024
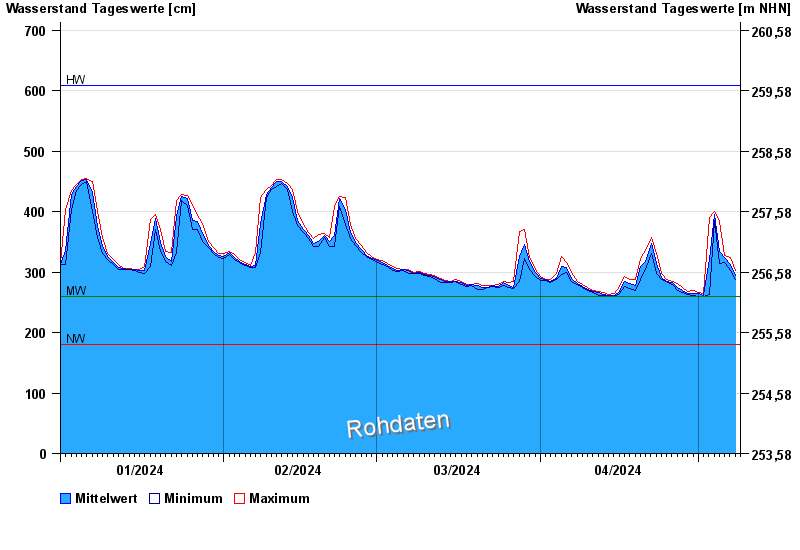
| Date | Mean value [cm] | Maximum [cm] | Minimum [cm] |
|---|---|---|---|
| 08.05.2024 | 294 | 302 | 287 |
| 07.05.2024 | 313 | 324 | 302 |
| 06.05.2024 | 324 | 328 | 316 |
| 05.05.2024 | 334 | 384 | 315 |
| 04.05.2024 | 396 | 400 | 386 |
| 03.05.2024 | 320 | 391 | 263 |
| 02.05.2024 | 262 | 264 | 259 |
© Bayerisches Landesamt für Umwelt 2024