
- Start >
- Rivers >
- Waterlevel >
- Regnitz >
- Hollfeld >
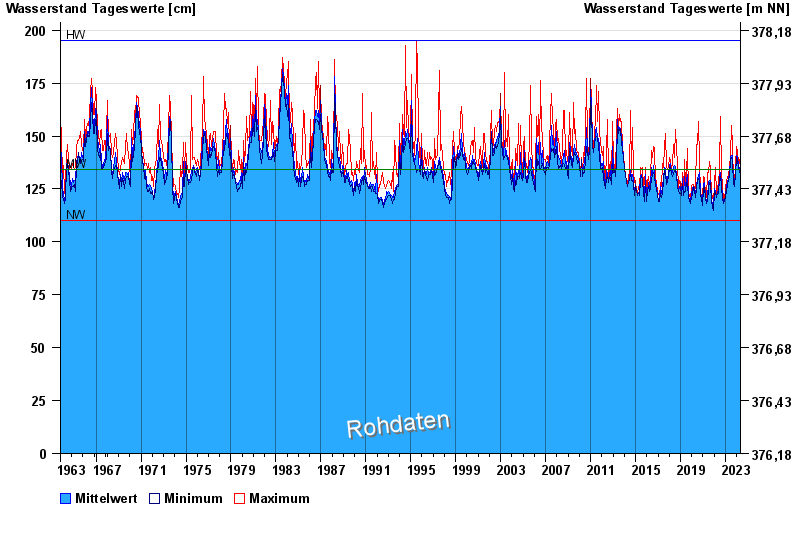
- Chart of total period

Chart of total period Hollfeld / Wiesent
Waterlevel from 01.11.1963 to 04.05.2024
| Date | Mean value [cm] | Maximum [cm] | Minimum [cm] |
|---|---|---|---|
| 04.05.2024 | 134 | 134 | 134 |
| 03.05.2024 | 134 | 135 | 134 |
| 02.05.2024 | 134 | 135 | 133 |
| 01.05.2024 | 134 | 134 | 133 |
| 30.04.2024 | 133 | 134 | 133 |
| 29.04.2024 | 133 | 134 | 133 |
| 28.04.2024 | 134 | 134 | 133 |
© Bayerisches Landesamt für Umwelt 2024