
- Start >
- Rivers >
- Waterlevel >
- Regnitz >
- Hohenkammer >
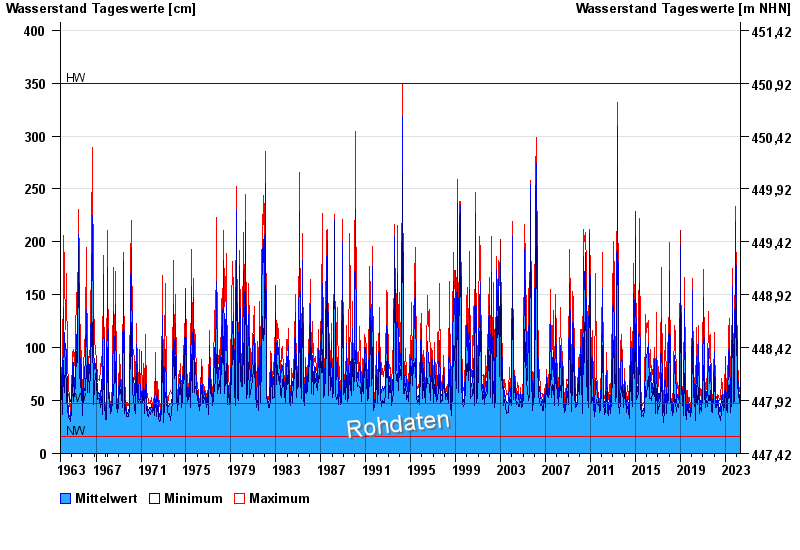
- Chart of total period

Chart of total period Hohenkammer / Glonn
Waterlevel from 01.11.1963 to 07.05.2024
| Date | Mean value [cm] | Maximum [cm] | Minimum [cm] |
|---|---|---|---|
| 07.05.2024 | 47 | 53 | 40 |
| 06.05.2024 | 40 | 53 | 31 |
| 05.05.2024 | 37 | 39 | 36 |
| 04.05.2024 | 37 | 38 | 35 |
| 03.05.2024 | 39 | 41 | 36 |
| 02.05.2024 | 41 | 43 | 40 |
| 01.05.2024 | 41 | 43 | 39 |
© Bayerisches Landesamt für Umwelt 2024