
- Start >
- Rivers >
- Waterlevel >
- Regnitz >
- Frauenkreuz >
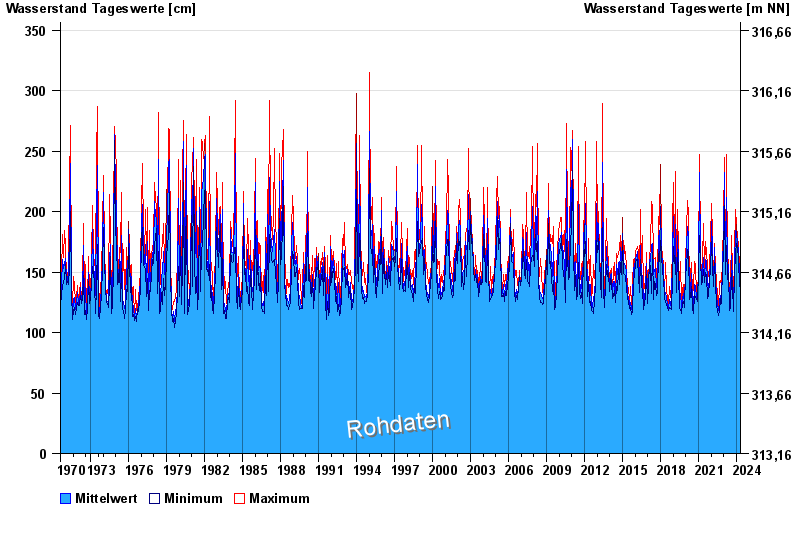
- Chart of total period

Chart of total period Frauenkreuz / Gründlach
Waterlevel from 24.08.1970 to 26.04.2024
| Date | Mean value [cm] | Maximum [cm] | Minimum [cm] |
|---|---|---|---|
| 26.04.2024 | 129 | 130 | 128 |
| 25.04.2024 | 130 | 130 | 130 |
| 24.04.2024 | 132 | 134 | 130 |
| 23.04.2024 | 137 | 140 | 134 |
| 22.04.2024 | 147 | 154 | 141 |
| 21.04.2024 | 142 | 154 | 135 |
| 20.04.2024 | 137 | 139 | 134 |
© Bayerisches Landesamt für Umwelt 2024