
- Start >
- Rivers >
- Waterlevel >
- Regnitz >
- Erlangen >
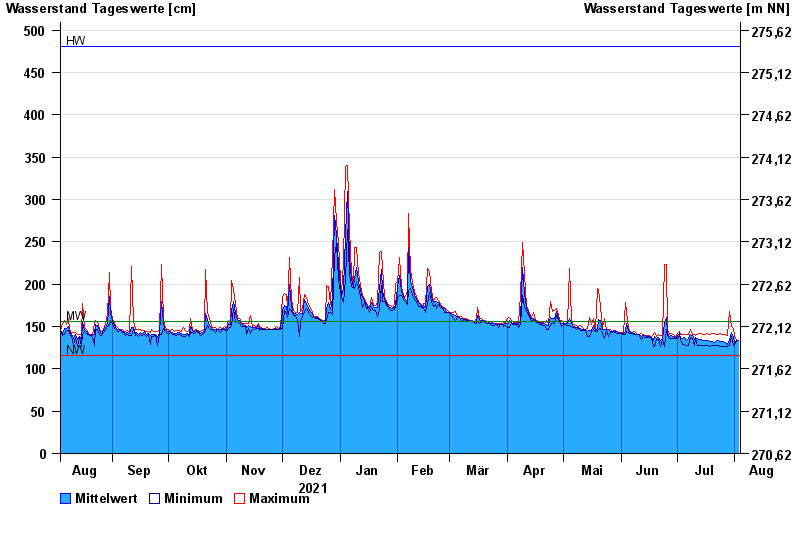
- Chart of year

Chart of year Erlangen / Schwabach
Waterlevel from 04.08.2021 to 03.08.2022
| Date | Mean value [cm] | Maximum [cm] | Minimum [cm] |
|---|---|---|---|
| 03.08.2022 | 133 | 133 | 133 |
| 02.08.2022 | 133 | 134 | 132 |
| 01.08.2022 | 131 | 139 | 129 |
| 31.07.2022 | 137 | 148 | 127 |
| 30.07.2022 | 143 | 150 | 138 |
| 29.07.2022 | 135 | 168 | 127 |
| 28.07.2022 | 129 | 139 | 126 |
© Bayerisches Landesamt für Umwelt 2024