
- Start >
- Rivers >
- Waterlevel >
- Regnitz >
- Erlangen >
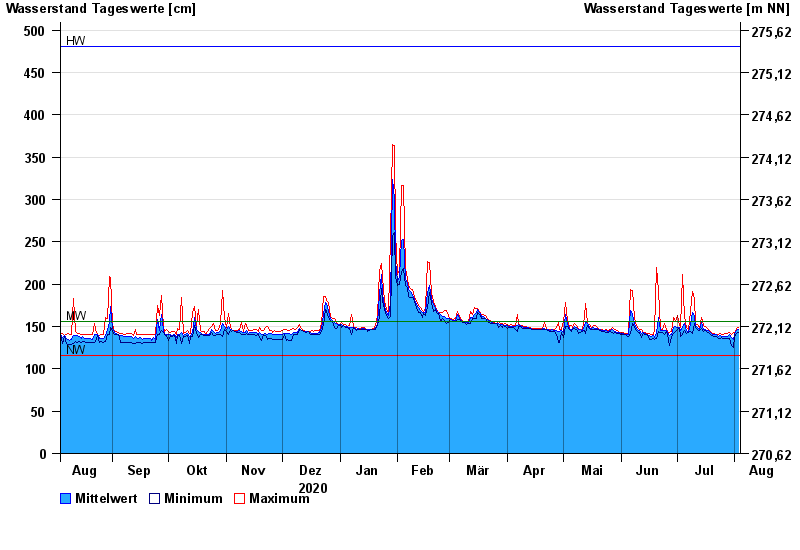
- Chart of year

Chart of year Erlangen / Schwabach
Waterlevel from 04.08.2020 to 03.08.2021
| Date | Mean value [cm] | Maximum [cm] | Minimum [cm] |
|---|---|---|---|
| 03.08.2021 | 146 | 149 | 143 |
| 02.08.2021 | 145 | 148 | 142 |
| 01.08.2021 | 140 | 142 | 138 |
| 31.07.2021 | 135 | 143 | 125 |
| 30.07.2021 | 137 | 141 | 127 |
| 29.07.2021 | 141 | 143 | 136 |
| 28.07.2021 | 138 | 142 | 136 |
© Bayerisches Landesamt für Umwelt 2024