
- Start >
- Rivers >
- Waterlevel >
- Regnitz >
- Büg >
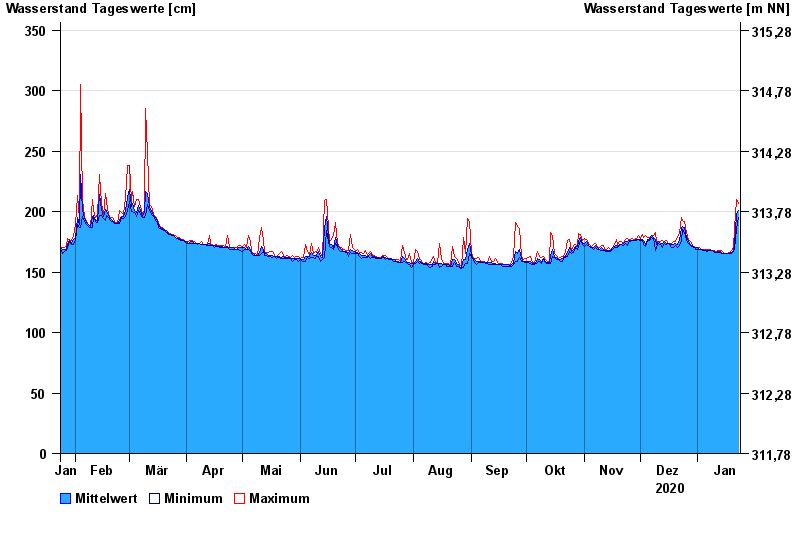
- Chart of year

Chart of year Büg / Schwabach
Waterlevel from 24.01.2020 to 23.01.2021
- 20.07.2011 Wasserstand: 409 cm
- 28.10.1998 Wasserstand: 404 cm
- 26.01.1995 Wasserstand: 401 cm
- 29.01.2021 Wasserstand: 390 cm
- 19.07.1966 Wasserstand: 390 cm
| Date | Mean value [cm] | Maximum [cm] | Minimum [cm] |
|---|---|---|---|
| 23.01.2021 | 201 | 207 | 195 |
| 22.01.2021 | 198 | 210 | 186 |
| 21.01.2021 | 173 | 186 | 169 |
| 20.01.2021 | 168 | 170 | 167 |
| 19.01.2021 | 166 | 168 | 165 |
| 18.01.2021 | 165 | 166 | 165 |
| 17.01.2021 | 165 | 165 | 165 |
© Bayerisches Landesamt für Umwelt 2024