
- Start >
- Rivers >
- Waterlevel >
- Regnitz >
- Büg >
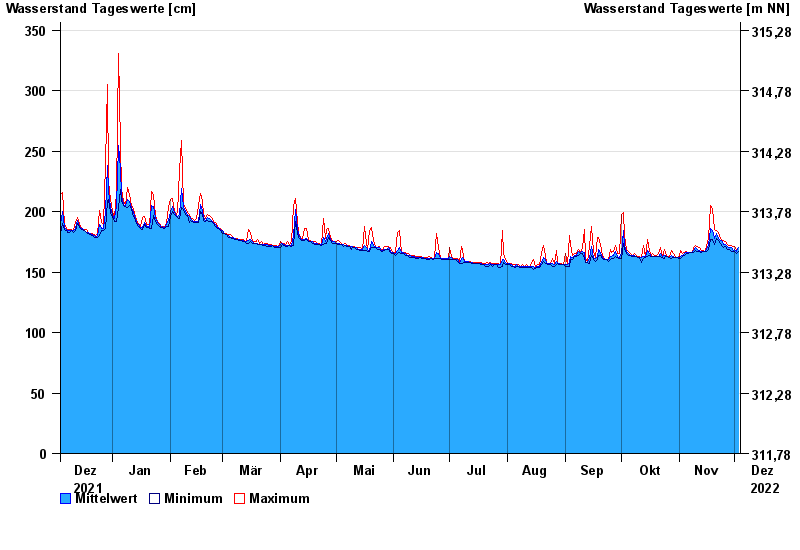
- Chart of year

Chart of year Büg / Schwabach
Waterlevel from 04.12.2021 to 03.12.2022
- 20.07.2011 Wasserstand: 409 cm
- 28.10.1998 Wasserstand: 404 cm
- 26.01.1995 Wasserstand: 401 cm
- 29.01.2021 Wasserstand: 390 cm
- 19.07.1966 Wasserstand: 390 cm
| Date | Mean value [cm] | Maximum [cm] | Minimum [cm] |
|---|---|---|---|
| 03.12.2022 | 170 | 170 | 167 |
| 02.12.2022 | 167 | 168 | 165 |
| 01.12.2022 | 169 | 171 | 167 |
| 30.11.2022 | 168 | 171 | 167 |
| 29.11.2022 | 170 | 172 | 167 |
| 28.11.2022 | 170 | 172 | 169 |
| 27.11.2022 | 171 | 173 | 169 |
© Bayerisches Landesamt für Umwelt 2024