
- Start >
- Rivers >
- Waterlevel >
- Regnitz >
- Büg >
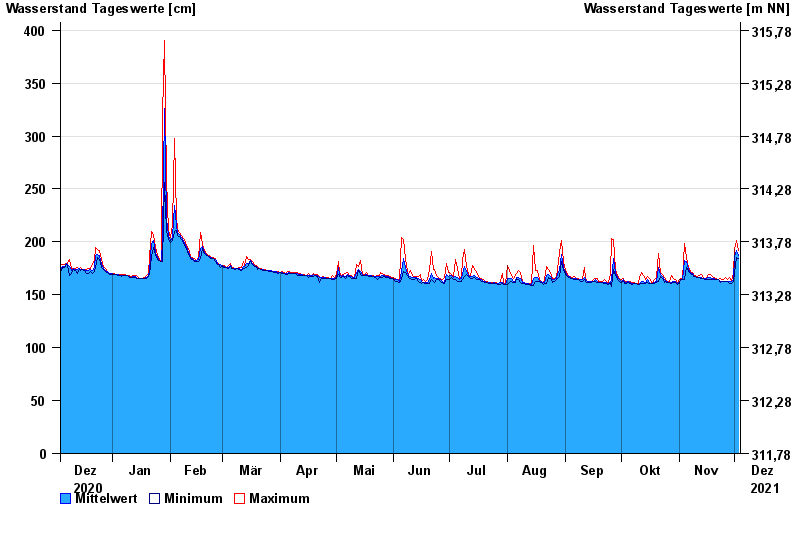
- Chart of year

Chart of year Büg / Schwabach
Waterlevel from 04.12.2020 to 03.12.2021
| Date | Mean value [cm] | Maximum [cm] | Minimum [cm] |
|---|---|---|---|
| 03.12.2021 | 187 | 192 | 184 |
| 02.12.2021 | 192 | 201 | 185 |
| 01.12.2021 | 186 | 193 | 170 |
| 30.11.2021 | 164 | 170 | 163 |
| 29.11.2021 | 163 | 163 | 161 |
| 28.11.2021 | 163 | 166 | 161 |
| 27.11.2021 | 163 | 164 | 163 |
© Bayerisches Landesamt für Umwelt 2024