
- Start >
- Rivers >
- Waterlevel >
- Regnitz >
- Büg >
- Chart of year

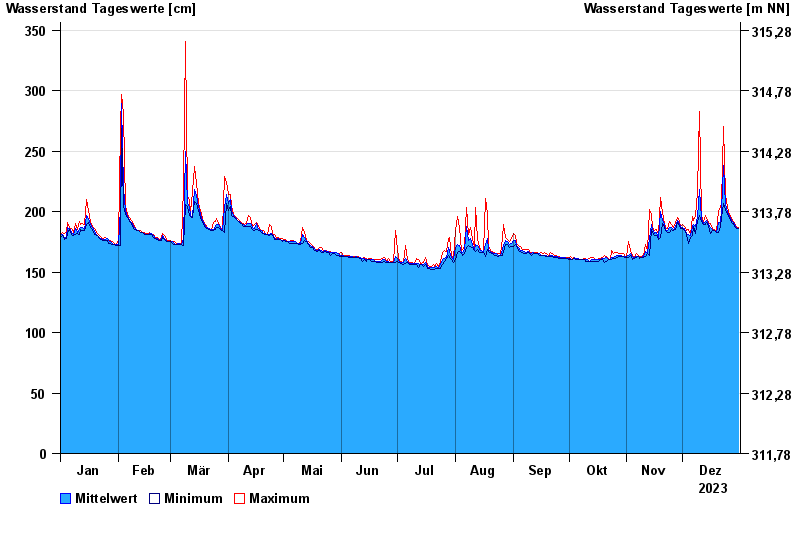
Chart of year Büg / Schwabach
Waterlevel from 01.01.2023 to 31.12.2023
| Date | Mean value [cm] | Maximum [cm] | Minimum [cm] |
|---|---|---|---|
| 31.12.2023 | 186 | 187 | 186 |
| 30.12.2023 | 187 | 188 | 186 |
| 29.12.2023 | 189 | 190 | 188 |
| 28.12.2023 | 191 | 192 | 190 |
| 27.12.2023 | 193 | 194 | 191 |
| 26.12.2023 | 196 | 198 | 194 |
| 25.12.2023 | 200 | 203 | 198 |
© Bayerisches Landesamt für Umwelt 2024