
- Start >
- Rivers >
- Waterlevel >
- Regnitz >
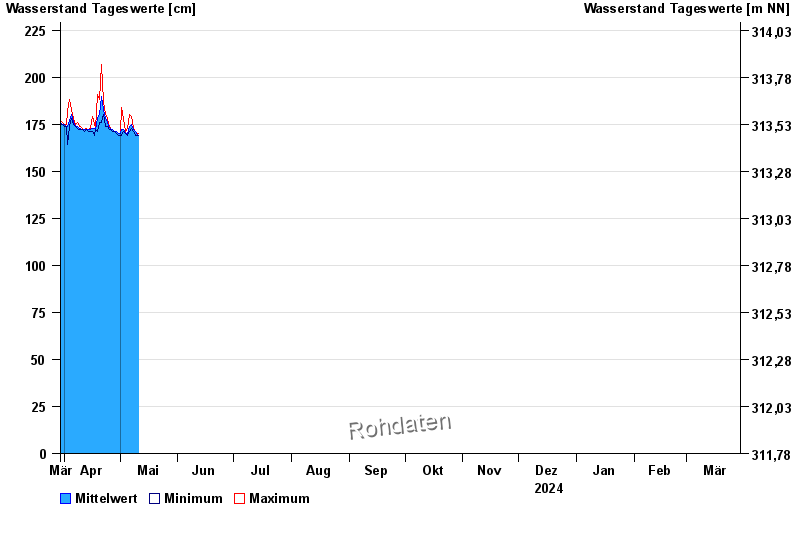
- Büg >
- Chart of year

Chart of year Büg / Schwabach
Waterlevel from 30.03.2024 to 29.03.2025
- 20.07.2011 Wasserstand: 409 cm
- 28.10.1998 Wasserstand: 404 cm
- 26.01.1995 Wasserstand: 401 cm
- 29.01.2021 Wasserstand: 390 cm
- 19.07.1966 Wasserstand: 390 cm
| Date | Mean value [cm] | Maximum [cm] | Minimum [cm] |
|---|---|---|---|
| 27.04.2024 | 172 | 172 | 171 |
| 26.04.2024 | 173 | 173 | 172 |
| 25.04.2024 | 174 | 175 | 173 |
| 24.04.2024 | 176 | 178 | 174 |
| 23.04.2024 | 178 | 180 | 174 |
| 22.04.2024 | 183 | 187 | 180 |
| 21.04.2024 | 190 | 207 | 176 |
© Bayerisches Landesamt für Umwelt 2024