
- Start >
- Rivers >
- Waterlevel >
- Regnitz >
- Büg >
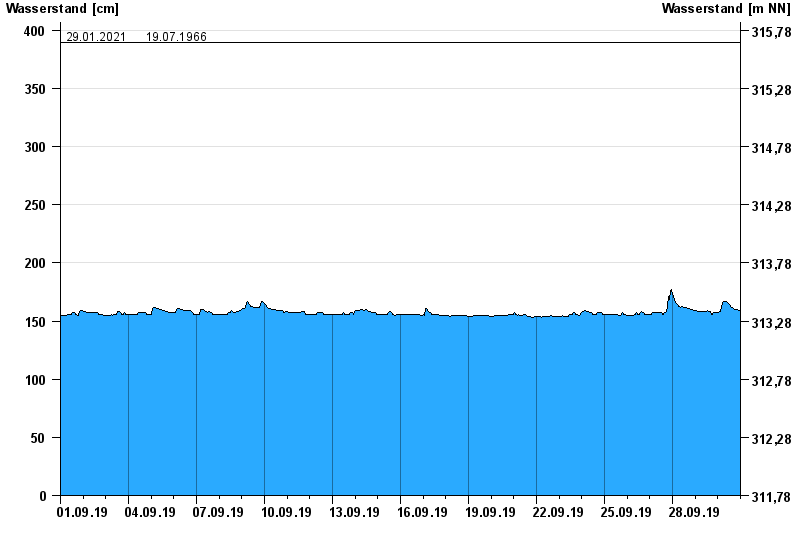
- Chart of month

Chart of month Büg / Schwabach
Waterlevel from 01.09.2019 to 30.09.2019
- 20.07.2011 Wasserstand: 409 cm
- 28.10.1998 Wasserstand: 404 cm
- 26.01.1995 Wasserstand: 401 cm
- 29.01.2021 Wasserstand: 390 cm
- 19.07.1966 Wasserstand: 390 cm
| Date | Waterlevel [cm] |
|---|---|
| 01.10.2019 00:45 | 159 |
| 01.10.2019 00:30 | 159 |
| 01.10.2019 00:15 | 159 |
| 01.10.2019 00:00 | 159 |
| 30.09.2019 23:45 | 159 |
| 30.09.2019 23:30 | 159 |
| 30.09.2019 23:15 | 159 |
© Bayerisches Landesamt für Umwelt 2024