
- Start >
- Rivers >
- Waterlevel >
- Regnitz >
- Büg >
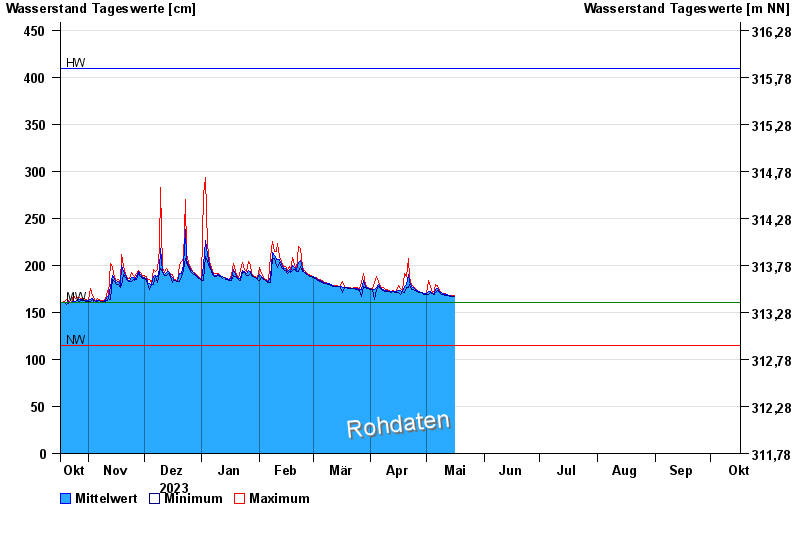
- Chart of year

Chart of year Büg / Schwabach
Waterlevel from 17.10.2023 to 16.10.2024
| Date | Mean value [cm] | Maximum [cm] | Minimum [cm] |
|---|---|---|---|
| 17.05.2024 | 168 | 168 | 168 |
| 16.05.2024 | 167 | 168 | 167 |
| 15.05.2024 | 167 | 168 | 167 |
| 14.05.2024 | 168 | 168 | 167 |
| 13.05.2024 | 168 | 168 | 168 |
| 12.05.2024 | 169 | 169 | 168 |
| 11.05.2024 | 169 | 170 | 168 |
© Bayerisches Landesamt für Umwelt 2024