
- Start >
- Rivers >
- Waterlevel >
- Untere Donau >
- Zwiesel >
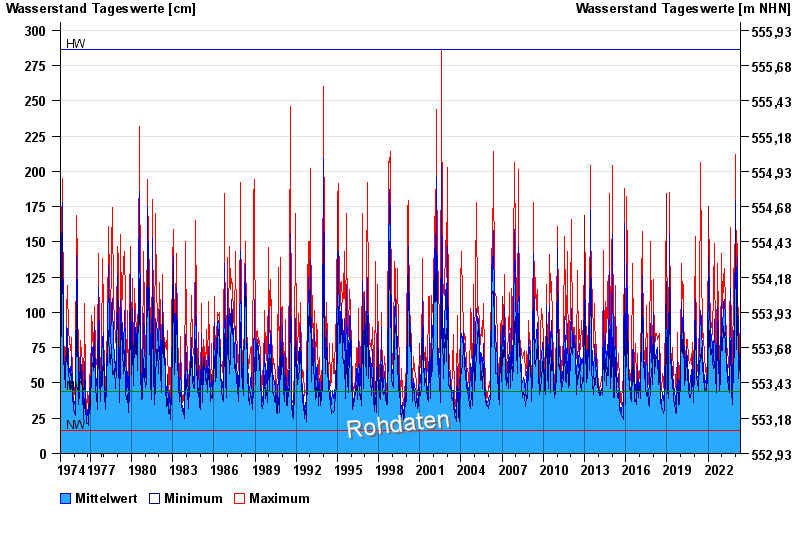
- Chart of total period

Chart of total period Zwiesel / Schwarzer Regen
Waterlevel from 01.11.1974 to 09.05.2024
| Date | Mean value [cm] | Maximum [cm] | Minimum [cm] |
|---|---|---|---|
| 09.05.2024 | 44 | 45 | 44 |
| 08.05.2024 | 48 | 53 | 44 |
| 07.05.2024 | 68 | 92 | 53 |
| 06.05.2024 | 41 | 77 | 35 |
| 05.05.2024 | 38 | 41 | 35 |
| 04.05.2024 | 39 | 40 | 37 |
| 03.05.2024 | 40 | 41 | 39 |
© Bayerisches Landesamt für Umwelt 2024