
- Start >
- Rivers >
- Waterlevel >
- Untere Donau >
- Vilsbiburg >
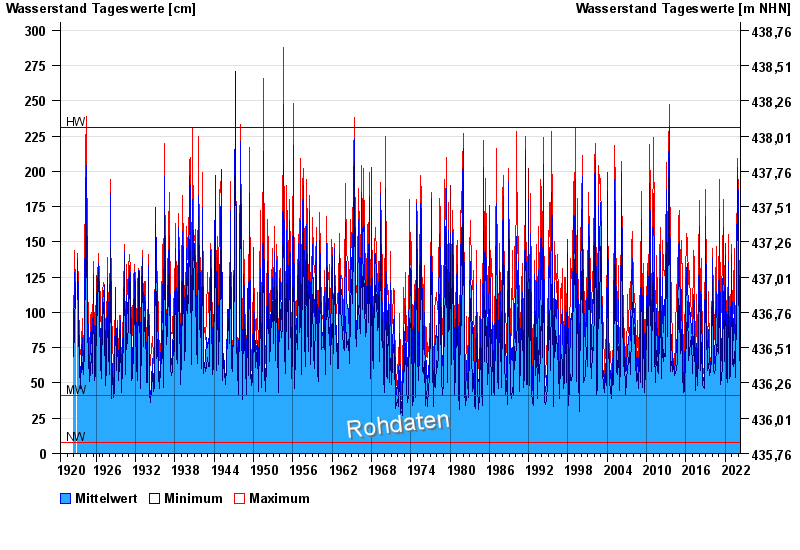
- Chart of total period

Chart of total period Vilsbiburg / Große Vils
Waterlevel from 22.07.1920 to 29.04.2024
| Date | Mean value [cm] | Maximum [cm] | Minimum [cm] |
|---|---|---|---|
| 29.04.2024 | 56 | 56 | 56 |
| 28.04.2024 | 55 | 56 | 54 |
| 27.04.2024 | 41 | 55 | 35 |
| 26.04.2024 | 39 | 44 | 32 |
| 25.04.2024 | 46 | 47 | 44 |
| 24.04.2024 | 50 | 54 | 47 |
| 23.04.2024 | 59 | 66 | 54 |
© Bayerisches Landesamt für Umwelt 2024