
- Start >
- Rivers >
- Waterlevel >
- Untere Donau >
- Simbach >
- Chart of total period

Chart of total period Simbach / Simbach
Waterlevel from 21.12.2000 to 02.05.2024
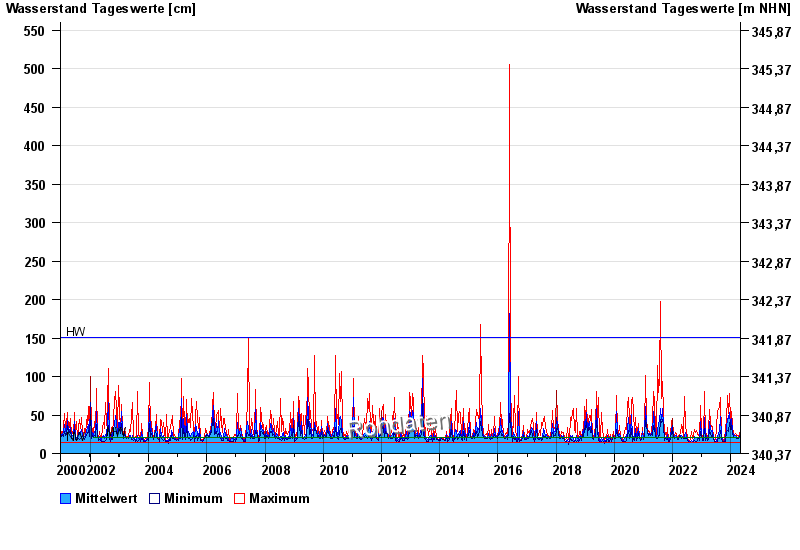
| Date | Mean value [cm] | Maximum [cm] | Minimum [cm] |
|---|---|---|---|
| 02.05.2024 | 21 | 21 | 21 |
| 01.05.2024 | 22 | 24 | 20 |
| 30.04.2024 | 20 | 21 | 19 |
| 29.04.2024 | 20 | 21 | 20 |
| 28.04.2024 | 20 | 21 | 20 |
| 27.04.2024 | 20 | 22 | 20 |
| 26.04.2024 | 21 | 22 | 20 |
© Bayerisches Landesamt für Umwelt 2024