
- Start >
- Rivers >
- Waterlevel >
- Untere Donau >
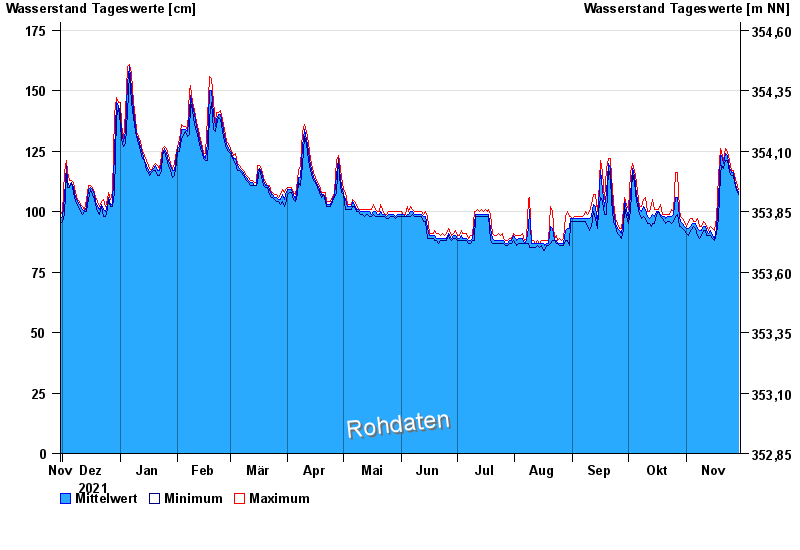
- Schwandorf >
- Chart of year

Chart of year Schwandorf / Naab
Waterlevel from 30.11.2021 to 29.11.2022
 Für diesen Pegel sind keine Meldestufen hinterlegt.
note
Pegel bis auf Weiteres außer Betrieb wegen Brückenbauarbeiten.
| Date | Mean value [cm] | Maximum [cm] | Minimum [cm] |
|---|---|---|---|
| 29.11.2022 | 108 | 109 | 107 |
| 28.11.2022 | 110 | 112 | 109 |
| 27.11.2022 | 113 | 115 | 112 |
| 26.11.2022 | 116 | 117 | 115 |
| 25.11.2022 | 116 | 117 | 115 |
| 24.11.2022 | 118 | 121 | 116 |
| 23.11.2022 | 123 | 125 | 121 |
© Bayerisches Landesamt für Umwelt 2024