
- Start >
- Rivers >
- Waterlevel >
- Untere Donau >
- Sägmühle >
- Chart of total period

Chart of total period Sägmühle / Schwarzer Regen
Waterlevel from 01.11.1975 to 26.04.2024
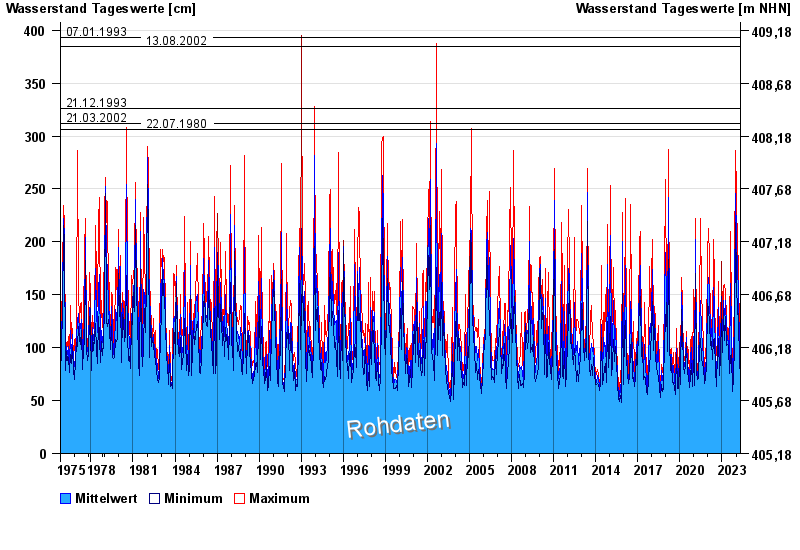
- 07.01.1993 Wasserstand: 393 cm
- 13.08.2002 Wasserstand: 385 cm
- 21.12.1993 Wasserstand: 326 cm
- 21.03.2002 Wasserstand: 312 cm
- 22.07.1980 Wasserstand: 306 cm
| Date | Mean value [cm] | Maximum [cm] | Minimum [cm] |
|---|---|---|---|
| 26.04.2024 | 76 | 77 | 75 |
| 25.04.2024 | 76 | 78 | 75 |
| 24.04.2024 | 78 | 80 | 75 |
| 23.04.2024 | 82 | 86 | 77 |
| 22.04.2024 | 88 | 93 | 84 |
| 21.04.2024 | 98 | 114 | 90 |
| 20.04.2024 | 119 | 129 | 102 |
© Bayerisches Landesamt für Umwelt 2024