
- Start >
- Rivers >
- Waterlevel >
- Untere Donau >
- Reichstorf >
- Chart of total period

Chart of total period Reichstorf / Vilsflutkanal
Waterlevel from 01.11.1963 to 29.04.2024
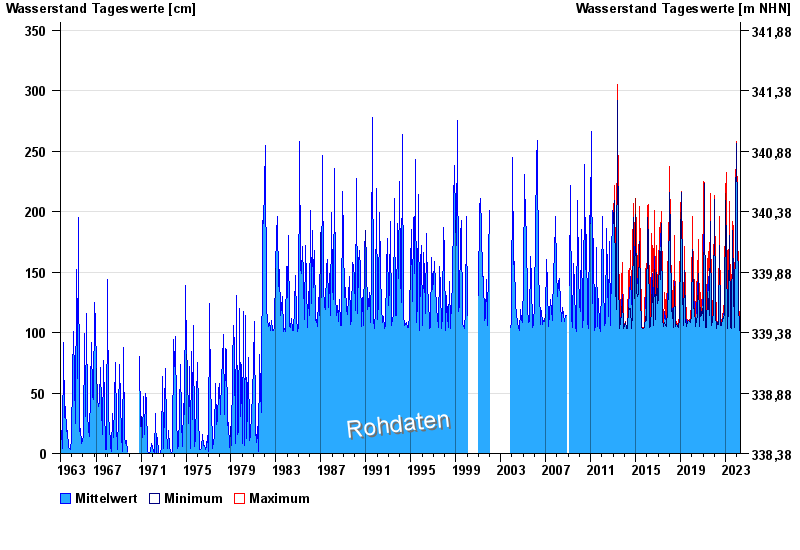
| Date | Mean value [cm] | Maximum [cm] | Minimum [cm] |
|---|---|---|---|
| 29.04.2024 | 102 | 102 | 102 |
| 28.04.2024 | 102 | 102 | 102 |
| 27.04.2024 | 102 | 102 | 102 |
| 26.04.2024 | 102 | 102 | 102 |
| 25.04.2024 | 102 | 102 | 102 |
| 24.04.2024 | 103 | 105 | 102 |
| 23.04.2024 | 104 | 106 | 102 |
© Bayerisches Landesamt für Umwelt 2024