
- Start >
- Rivers >
- Waterlevel >
- Untere Donau >
- Pfelling >
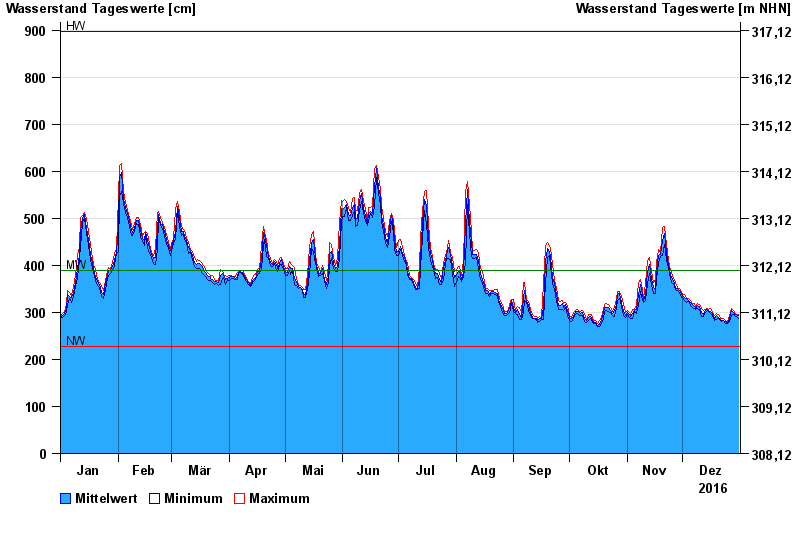
- Chart of year

Chart of year Pfelling / Donau
Waterlevel from 01.01.2016 to 31.12.2016
| Date | Mean value [cm] | Maximum [cm] | Minimum [cm] |
|---|---|---|---|
| 31.12.2016 | 293 | 296 | 286 |
| 30.12.2016 | 295 | 296 | 291 |
| 29.12.2016 | 295 | 299 | 294 |
| 28.12.2016 | 299 | 303 | 296 |
| 27.12.2016 | 303 | 308 | 293 |
| 26.12.2016 | 287 | 293 | 280 |
| 25.12.2016 | 277 | 281 | 276 |
© Bayerisches Landesamt für Umwelt 2024