
- Start >
- Rivers >
- Waterlevel >
- Untere Donau >
- Oberndorf >
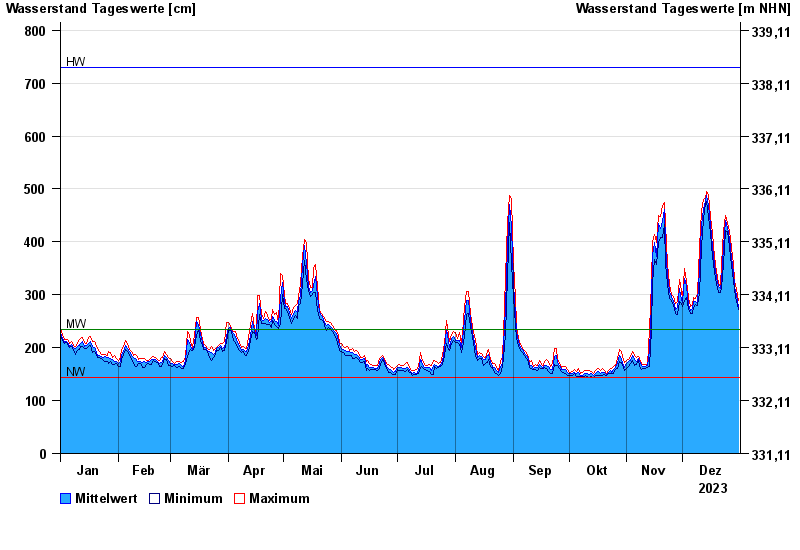
- Chart of year

Chart of year Oberndorf / Donau
Waterlevel from 01.01.2023 to 31.12.2023
| Date | Mean value [cm] | Maximum [cm] | Minimum [cm] |
|---|---|---|---|
| 31.12.2023 | 278 | 290 | 272 |
| 30.12.2023 | 298 | 310 | 288 |
| 29.12.2023 | 315 | 327 | 308 |
| 28.12.2023 | 342 | 358 | 327 |
| 27.12.2023 | 371 | 389 | 356 |
| 26.12.2023 | 407 | 421 | 389 |
| 25.12.2023 | 427 | 434 | 420 |
© Bayerisches Landesamt für Umwelt 2024