
- Start >
- Rivers >
- Waterlevel >
- Untere Donau >
- Oberndorf >
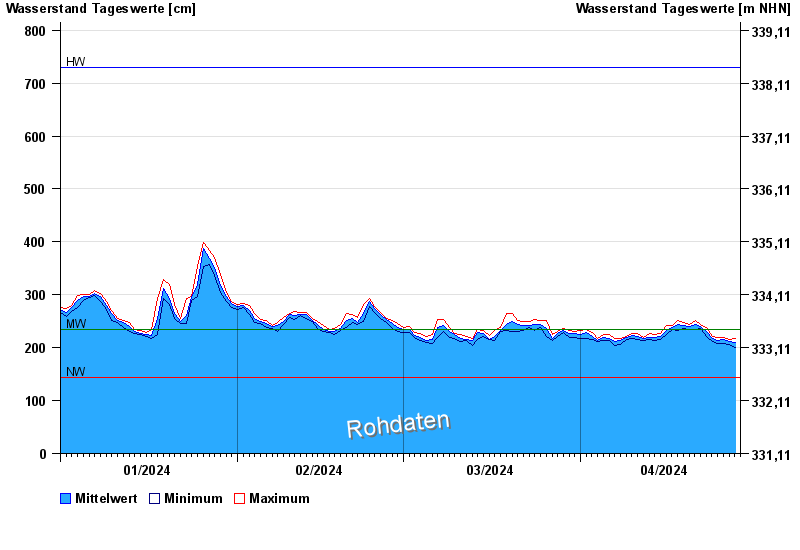
- Chart of year

Chart of year Oberndorf / Donau
Waterlevel from 01.01.2024 to 28.04.2024
| Date | Mean value [cm] | Maximum [cm] | Minimum [cm] |
|---|---|---|---|
| 28.04.2024 | 213 | 217 | 209 |
| 27.04.2024 | 211 | 215 | 206 |
| 26.04.2024 | 215 | 220 | 207 |
| 25.04.2024 | 214 | 219 | 207 |
| 24.04.2024 | 217 | 222 | 212 |
| 23.04.2024 | 231 | 239 | 221 |
| 22.04.2024 | 240 | 243 | 236 |
© Bayerisches Landesamt für Umwelt 2024