
- Start >
- Rivers >
- Waterlevel >
- Untere Donau >
- Moosburg >
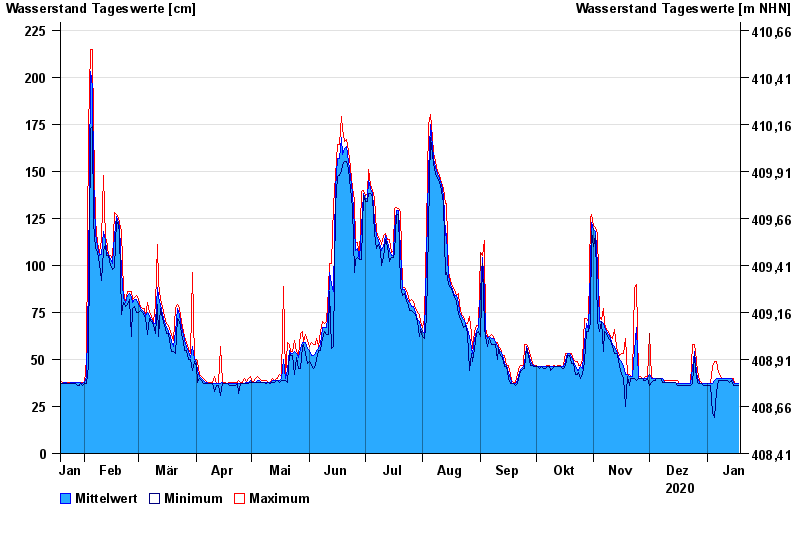
- Chart of year

Chart of year Moosburg / Amper
Waterlevel from 19.01.2020 to 18.01.2021
- 05.06.2013 Wasserstand: 363 cm
- 08.08.2010 Wasserstand: 272 cm
- 04.06.2010 Wasserstand: 257 cm
- 03.02.2013 Wasserstand: 242 cm
- 15.01.2019 Wasserstand: 241 cm
| Date | Mean value [cm] | Maximum [cm] | Minimum [cm] |
|---|---|---|---|
| 18.01.2021 | 37 | 37 | 36 |
| 17.01.2021 | 37 | 37 | 36 |
| 16.01.2021 | 37 | 37 | 36 |
| 15.01.2021 | 38 | 40 | 36 |
| 14.01.2021 | 40 | 40 | 39 |
| 13.01.2021 | 40 | 40 | 38 |
| 12.01.2021 | 40 | 40 | 39 |
© Bayerisches Landesamt für Umwelt 2024