
- Start >
- Rivers >
- Waterlevel >
- Untere Donau >
- Mainburg >
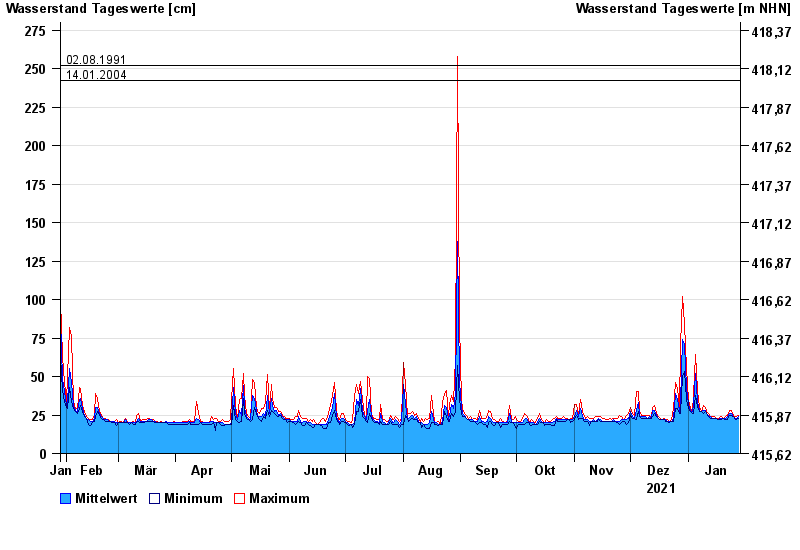
- Chart of year

Chart of year Mainburg / Abens
Waterlevel from 29.01.2021 to 28.01.2022
- 15.02.1990 Wasserstand: 299 cm
- 02.06.2013 Wasserstand: 291 cm
- 13.04.1994 Wasserstand: 279 cm
- 02.08.1991 Wasserstand: 252 cm
- 14.01.2004 Wasserstand: 242 cm
| Date | Mean value [cm] | Maximum [cm] | Minimum [cm] |
|---|---|---|---|
| 28.01.2022 | 24 | 25 | 23 |
| 27.01.2022 | 23 | 24 | 22 |
| 26.01.2022 | 23 | 24 | 23 |
| 25.01.2022 | 24 | 25 | 24 |
| 24.01.2022 | 26 | 28 | 25 |
| 23.01.2022 | 26 | 28 | 25 |
| 22.01.2022 | 24 | 25 | 22 |
© Bayerisches Landesamt für Umwelt 2024